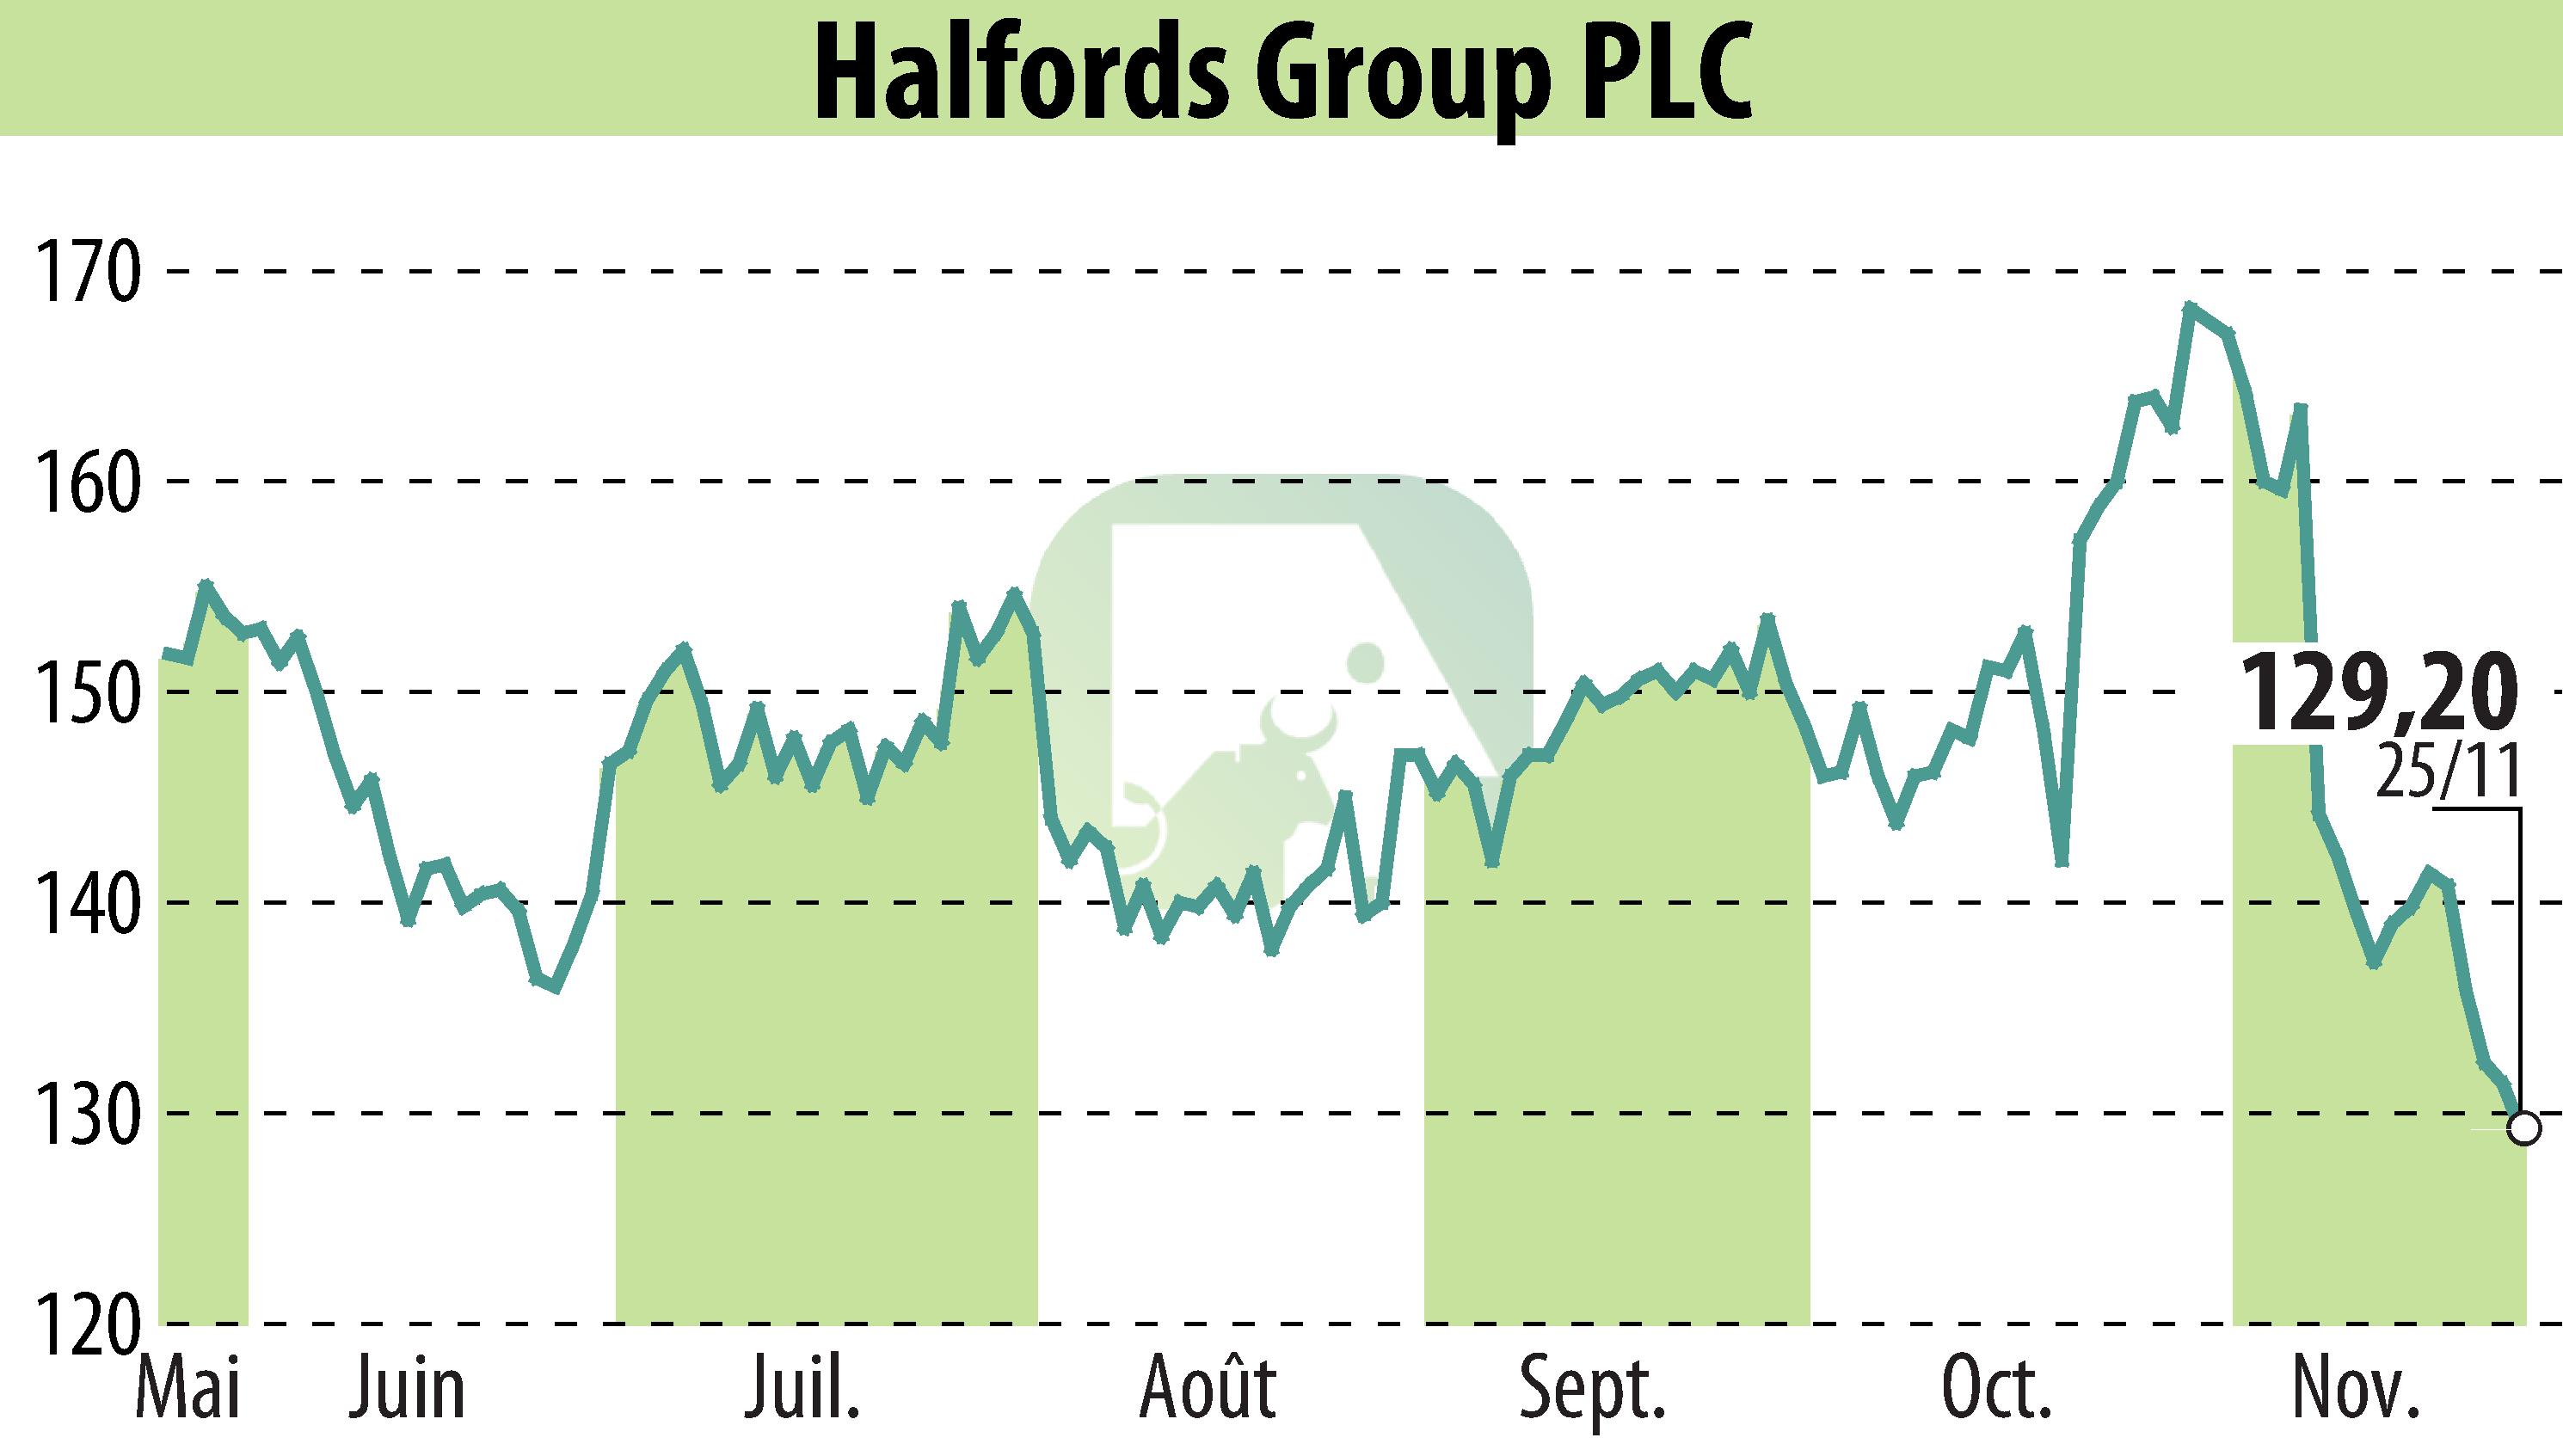
on Halfords (isin : GB00B012TP20)
Halfords Group PLC Reports Interim Results for H1 FY25

Halfords Group PLC reported its interim results for the 26 weeks ending on 27 September 2024. The company demonstrated solid financial performance despite marginal declines in revenue. Halfords achieved an underlying profit before tax of £21 million, with a slight decrease of 1.4% compared to the previous year.
The company’s revenue decreased by 1% to £864.8 million, with Autocentres revenue declining by 2.3% and Retail taking a slight dip of 0.1%. However, the gross margin improved by 160 basis points to 49.4%, attributed to price optimization and the Better Buying program.
Halfords made significant strategic progress by advancing its Fusion Motoring Services strategy, aiming to expand to 40 sites, enhancing the integration between Retail and Autocentres. The company's balance sheet remains strong with a net cash position of £1.3 million, showing an improvement of £48.3 million year-on-year.
R. P.
Copyright © 2024 FinanzWire, all reproduction and representation rights reserved.
Disclaimer: although drawn from the best sources, the information and analyzes disseminated by FinanzWire are provided for informational purposes only and in no way constitute an incentive to take a position on the financial markets.
Click here to consult the press release on which this article is based
See all Halfords news
