from Avino Silver & Gold Mines Ltd. (NASDAQ:ASM)
Avino Reports Oxide Tailings Project Prefeasibility Study With After-Tax NPV of US$61 Million and 26% IRR
VANCOUVER, BC / ACCESSWIRE / February 5, 2024 / Avino Silver & Gold Mines Ltd. (TSX:ASM)(NYSE American:ASM)(FSE:GV6) is pleased to report the results of the Preliminary Feasibility Study (the "PFS") prepared in accordance with National Instrument 43-101 - Standards for Disclosure for Mineral Projects ("NI 43-101") for its Oxide Tailings Project (the "OTP" or the "Project") at the Company's Avino Mine Operations located near Durango in west-central Mexico (the "Property"). The work that was completed as the basis for the PFS was managed by Tetra Tech Canada Inc. of Vancouver, BC.
Highlights include:
- NPV US$98 million (pre-tax) and US$61 million (post-tax) at a 5% discount rate.
- IRR 35% (pre-tax) and 26% (post-tax).
- Payback Period 2.9 years (pre-tax) and 3.5 years (post-tax).
- Initial Capital Cost: US$49.1 million, including a complete on-site tailing leaching plant for silver and gold extraction and a contingency provision in the amount of US$5.3 million. The ongoing sustaining capital cost is US$5.1 million.
- LOM Average Production Unit Cost: On-site Operating Costs (OOC) and All-In Sustaining Cost (AISC) of US$9.71 and US $10.23 per tr oz silver equivalent, respectively.
- Proven and probable mineral reserves of 6.70 Million tonnes at a silver and gold grade of 55 g/t and 0.47 g/t respectively.
- Nominal Processing Rate over a 9-year LOM: 2,250 tonnes per day or 821,250 tonnes per year, with a 92% plant availability.
- Metal Recoveries: 77.2% Ag and 74.9% Au.
- Doré Production: Total 9,073,000 oz Ag and 76,000 oz Au, life-of-project (averaging 1,008,000 oz Ag and 8,445 oz Au per year).
- Direct Employment: 121 employees, with additional job positions related to indirect employment and contracted services.
- Ease of Construction and Operation: The Project is located within the existing Avino Mine operations. Site infrastructure such as power, water, and road network are well established.
- Elimination of risks associated with the conventional tailings design: A secondary Dry Stack Tailings Management Facility will comprise dewatered tailings being stored in a geotechnically stable impoundment.
- Elimination of risks associated with the heap leach design, which is replaced with a conventional tank leach design with a compact footprint. The process plant containment areas and berms on site will provide an additional layer of safety.
- The Project will generate US$52.4 million in tax contributions to the local economy and government.
The PFS will be filed on SEDAR+ (www.sedarplus.ca) under the Company's profile and filed on Form 6-K with the U.S. Securities and Exchange Commission within 45 days of this release. All currency values are presented in US$ unless otherwise specified.
"The completion of the PFS is a key milestone in Avino's path to transformational growth, said David Wolfin, President & CEO of Avino. "The economics of our oxide tailings project combined with the relatively low capital requirements has the potential to significantly enhance the current Avino operation and grow cashflow."
Peter Latta, VP Technical Services of Avino commented, "For the first time in Avino's lengthy history, we are proud to demonstrate Proven and Probable Mineral Reserves. We have taken a dynamic leaching approach to the tailings reprocessing to improve overall recoveries and mitigate the potential recovery variability compared with heap leaching. We have selected, in this design, a simple, conventional flowsheet to keep capital costs low and allow for a faster and simpler build if and when a construction decision is made."
The most notable improvement in the PFS financial results compared to the 2017 PEA is the 100% increase in Net Present Value (NPV) to US$98 million from US$49 million on a pre-tax basis. Other PFS highlights of significance include strong project economics, long mine life, minimal payback period, and exceptional ESG and tax contributions to the local economy.
Table 1 -Comparison to Previous Study
| Financials | Unit | 2024 PFS | 2017 PEA |
| NPV (pre-tax) | US$ million | 98 | 49 |
| NPV (post-tax) | US$ million | 61 | 28 |
| IRR (pre-tax) | % | 35 | 48 |
| IRR (post-tax) | % | 26 | 32 |
| Payback (pre-tax) | Years | 2.9 | 2.0 |
| Payback (post-tax) | Years | 3.5 | 2.6 |
| Project Life | Years | 9 | 7 |
| LOM Mill Feed | Million Tonnes | 6.7 | 3.1 |
| LOM Silver Production | tr oz | 9,073,000 | 6,173,000 |
| LOM Gold Production | tr oz | 76,000 | 33,000 |
| Processing Rate | Tpd | 2,250 | 1,370 |
| LOM Silver Recovery | % | 77 | 79 |
| LOM Gold Recovery | % | 75 | 73 |
| Initial CapEx | US$ million | 49.1 | 24.4 |
| Sustaining CapEx | US$ million | 5.1 | 4.4 |
| Onsite Operating Cost | US$/tr oz AgEq | 9.71 | 5.56 |
| All-In Sustaining Cost | US$/tr oz AgEq | 10.41 | 6.08 |
The 2024 PFS features improvements in comparison to the PEA that was completed in 2017. The life of the project has increased by 2 years, the silver production has increased almost 3 million ounces, and the gold production has more than doubled. The PFS includes processing rates of 2,250 tpd and an increase of 880 tpd.
Economic Analysis and Sensitivity Analysis
The economic analysis is based on the PFS mineral reserve estimate totalling 6.7 million tonnes of Proven and Probable Mineral Reserves at an average grade of 54.46 g/t Ag and 0.47 g/t Au. This reserve is adequate to allow for a 9-year project life, based on current tailings recovery assumptions including a processing rate of 2,250 tonnes per day. Metal recoveries are expected to average 77.2% and 74.9% for silver and gold, respectively.
The gold and silver prices for the financial analysis are based on 3-year trailing averages on Nov 7, 2023, as below:
- Silver price: US23.45/tr. oz
- Gold Price: US$1,839.51/tr. oz.
The exchange rate for US$ to MXN$ used for the project is 1.00:18.15.
These assumptions, together with capital cost and operating cost estimates noted above, result in a pre- tax NPV, at a 5% discount rate of $98M ($61M post-tax). The pre-tax payback period for the project is 2.9 years from the start of production (3.5 years post-tax). The project generates a pre-tax IRR of 35% (26% post-tax).
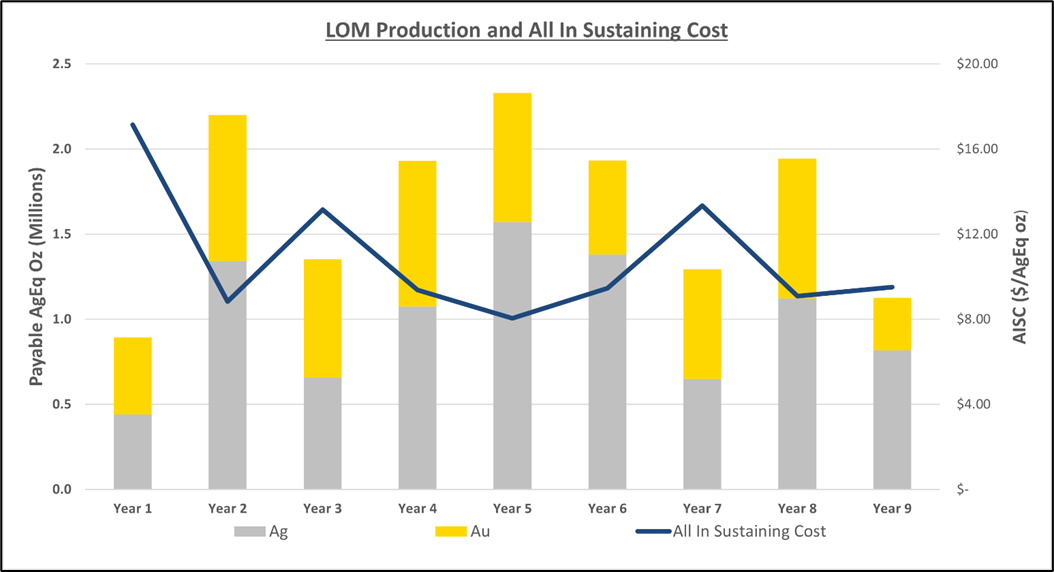
Figure 1: LOM Production and All In Sustaining Cost
A sensitivity analysis was performed to test the impact of changes to several key assumptions included in the economic model, with the results shown in following Figures and Table:
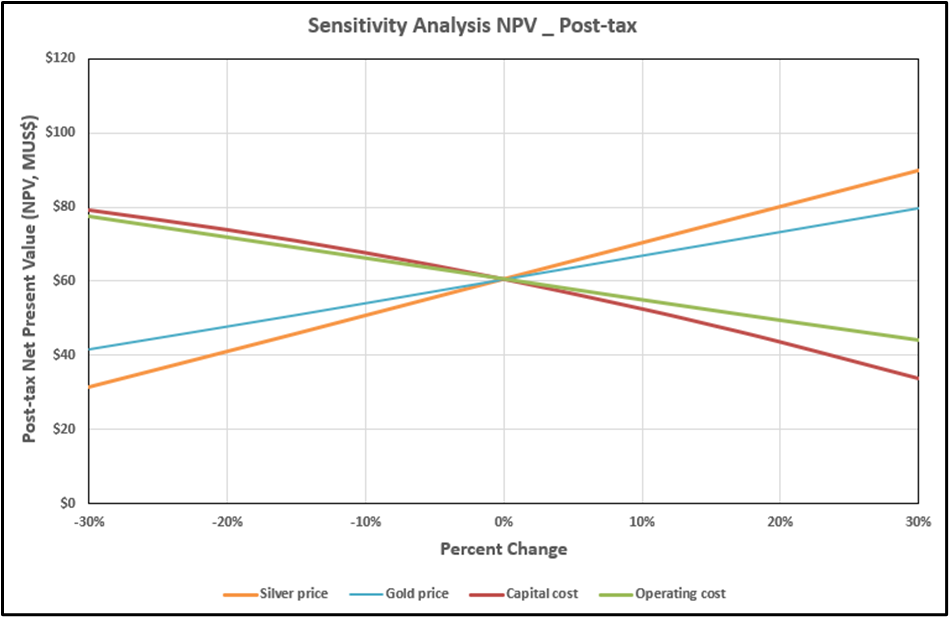
Figure 2: NPV (5%) Sensitivity (Post-Tax)
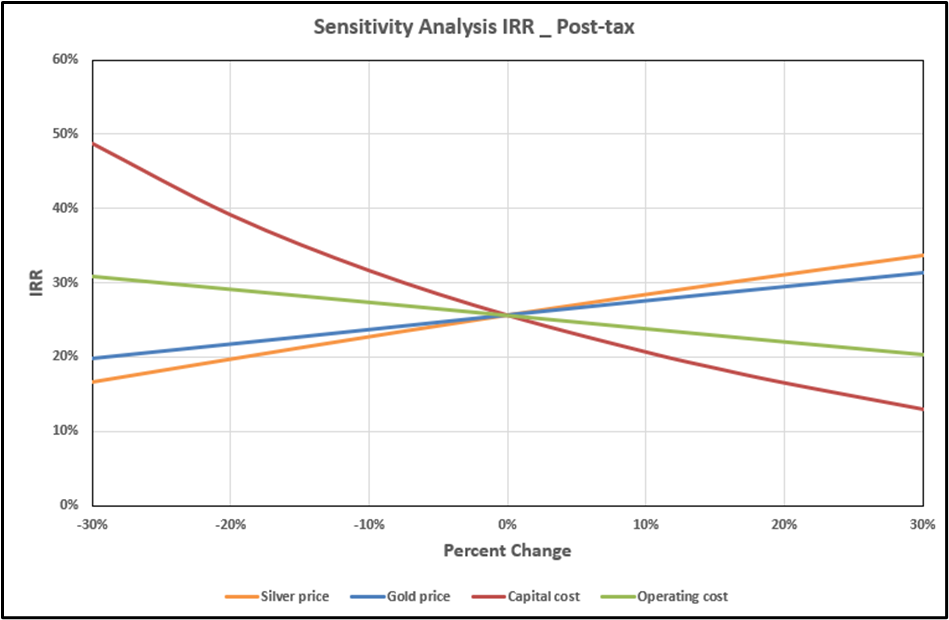
Figure 3: IRR Sensitivity (Post-Tax)
Table 2: Post-Tax Financial Result Summary
| Metrics | Gold Price | Silver Price | Undiscounted Cashflow | NPV @ 5% | IRR | Payback Years |
| Unit | US$/tr. oz | US$/tr. oz | M US$ | M US$ | % | Year |
| Base Case | 1,839.51 | 23.45 | 100.3 | 60.6 | 25.6 | 3.5 |
| +30% Case - Silver Price | 1,839.51 | 30.49 | 141.5 | 90.0 | 33.7 | 2.8 |
| +30% Case - Gold Price | 2,391.36 | 23.45 | 126.7 | 79.8 | 31.4 | 3.0 |
| -30% Case - Silver Price | 1,839.51 | 16.42 | 59.3 | 31.3 | 16.7 | 4.3 |
| -30% Case - Gold Price | 1,287.66 | 23.45 | 74.2 | 41.7 | 19.8 | 4.1 |
| Spot Price* | 2,055.65 | 23.06 | 108.4 | 66.5 | 27.5 | 3.3 |
* PM Trading on Date of January 12, 2024
Avino Oxide Tailings Project Mineral Reserves
The Mineral Reserves were estimated using both oxide and sulphide tailings and are based on Measured and Indicated Resources only. The pit design used for the estimation was at the PFS level. The ultimate pit limit was determined by the Lerchs-Grossman optimizer in Datamine™, with consideration of economic parameters and physical constraints such as pit road widths, mining bench width, and face angles for the recommended mining equipment. The Proven and Probable Mineral Reserves are given below.
Table 3: Mineral Reserve Statement of the Avino Oxide Tailings Project (Effective Date: January 16, 2024)
| Category | Quantity (million tonnes) | Average Ag Grade (g/t) | Average Au Grade (g/t) | Contained Ag Metal (million tr. oz) | Contained Au Metal (thousand tr. oz) |
| Proven | 4.27 | 61 | 0.47 | 8.37 | 65.01 |
| Probable | 2.43 | 43 | 0.47 | 3.38 | 36.53 |
| Total | 6.70 | 55 | 0.47 | 11.75 | 101.54 |
Notes:
- The effective date of the Mineral Reserve estimate is January 16, 2024. The QP for the estimate is Mr. Jay Li, P.Eng. of Tetra Tech.
- The Mineral Reserve estimates were prepared with reference to the 2014 Canadian Institute of Mining, Metallurgy and Petroleum (CIM) Definition Standards (2014 CIM Definition Standards) and the 2019 CIM Best Practice Guidelines.
- Reserves estimated assuming open pit mining methods.
- Reserves are reported on a dry in-situ basis.
- Reserves are based on a gold price of US $1850/tr oz., and silver price of US $22/tr oz, mining cost of US$1.00/t mined, milling costs of US$18.00/t feed, and G&A cost of US$3.00/t feed.
- Mineral Reserves include consideration for 1% mining dilution and 99% mining recovery.
- Ore-waste cut-off was based on US$21.00/t of NSR.
Mineral Resources
The PFS uses the latest updated mineral resource estimate that is based on US$1,800 per ounce gold, US$21.00 per ounce silver, and US$3.50 per pound copper. In addition, the resources are constrained by conceptual mining shapes. Measured and Indicated Mineral Resources at the Property are estimated at 34.7 million tonnes grading 63 grams per tonne silver, 0.54 grams per tonne gold, and 0.39% copper (70 million ounces of silver, 597 thousand ounces of gold, and 301 million pounds of copper). An additional 19.3 million tonnes are estimated in the Inferred Mineral Resource category grading 46 grams per tonne silver, 0.34 grams per tonne gold, and 0.37% copper (28.4 million ounces of silver, 213 thousand ounces of gold, and 159 million pounds of copper).
The mineral resources of the tailings deposit have been updated during 2023 in accordance with revised topographic data.
For information, the inclusive mineral resources (inclusive of mineral reserves) for the Avino Mine area (not including La Preciosa) are summarized in Table 2.
Table 4: Avino Mine Area - Mineral Resources (inclusive of Mineral Reserves, Effective Date: October 16, 2023)
Area/ Zone | Category | Mass (Mt) | Average Grade | Metal Content | ||||||
| AgEQ (g/t) | Ag (g/t) | Au (g/t) | Cu (%) | AgEQ | Ag | Au | Cu | |||
| (million tr oz) | (million tr oz) | (thousand tr oz) | (million lb) | |||||||
| ET Avino | MEA | 3.88 | 171 | 69 | 0.53 | 0.57 | 21.39 | 8.58 | 67 | 48.91 |
| IND | 23.92 | 146 | 58 | 0.53 | 0.44 | 112.41 | 44.59 | 409 | 234.08 | |
| M&I | 27.80 | 150 | 60 | 0.53 | 0.46 | 133.8 | 53.17 | 476 | 283 | |
| INF | 17.59 | 106 | 37 | 0.34 | 0.4 | 59.76 | 20.72 | 191 | 154.18 | |
| San Gonzalo | MEA | 0.33 | 332 | 244 | 1.17 | 0 | 3.53 | 2.59 | 12.42 | 0 |
| IND | 0.30 | 293 | 230 | 0.84 | 0 | 2.85 | 2.23 | 8.14 | 0 | |
| M&I | 0.63 | 313 | 237 | 1.01 | 0 | 6.38 | 4.83 | 20.56 | 0 | |
| INF | 0.25 | 297 | 271 | 0.35 | 0 | 2.35 | 2.14 | 2.74 | 0 | |
| Guadalupe | MEA | 0.00 | 0 | 0 | 0 | 0 | 0 | 0 | 0 | 0 |
| IND | 0.40 | 169 | 70 | 0.79 | 0.37 | 2.17 | 0.9 | 10.24 | 3.27 | |
| M&I | 0.40 | 169 | 70 | 0.79 | ||||||