from Faraday Copper Corp. (isin : CA2176212009)
Faraday Copper Announces PEA for Copper Creek with NPV US$713M and 4.2 Billion Pounds of Measured and Indicated Copper Mineral Resources
VANCOUVER, BC / ACCESSWIRE / May 3, 2023 / Faraday Copper Corp. ("Faraday" or the "Company") (TSX:FDY)(OTCQX:CPPKF) is pleased to announce the results from a Preliminary Economic Assessment ("PEA") and an updated Mineral Resource Estimate ("MRE") for its Copper Creek Project, located in Arizona, U.S. ("Copper Creek"). The PEA provides an economically viable base case for the development of Copper Creek.
All financial results are in U.S. dollars unless otherwise stated. The Company will hold a conference call and webcast on May 4, 2023 at 4:30pm ET to discuss the results of the PEA and MRE. Details are provided below.
Paul Harbidge, President and CEO, commented, "In the twenty months since restarting technical activities at Copper Creek, we have delivered an MRE with 4.2 billion pounds of copper in the Measured and Indicated category, an economically robust PEA and a pipeline of exploration targets. The PEA provides an excellent basis for the future development of Copper Creek and is the beginning of the Faraday story. The projected low initial capital and upfront open pit mine unlocks a large underground operation, for a combined mine life of more than 30 years. The project is expected to grow over time as the property is endowed with numerous untested exploration targets. Importantly, the results from our ongoing 10,000-metre drill program, which are not incorporated in the current studies, are anticipated to contribute to this growth in the future. We are planning a further 20,000-metre drill program to commence in the fourth quarter of this year as we continue to advance the project and unlock value for our stakeholders."
Highlights of the Copper Creek PEA*
- Attractive economics: Post-tax Net Present Value ("NPV") (7%) of $713 million and Internal Rate of Return ("IRR") of 16% (Table 1) and significant upside to higher metal prices (Table 4).
- Strong standalone open pit economics: Standalone open pit operation supports a pre-tax NPV (7%) of $337 million (Table 2).
- Robust project: Open pit mining provides a rapid payback on initial capital of four years and fully funds development of a bulk underground mine for a combined total mine life of 32 years (Table 1).
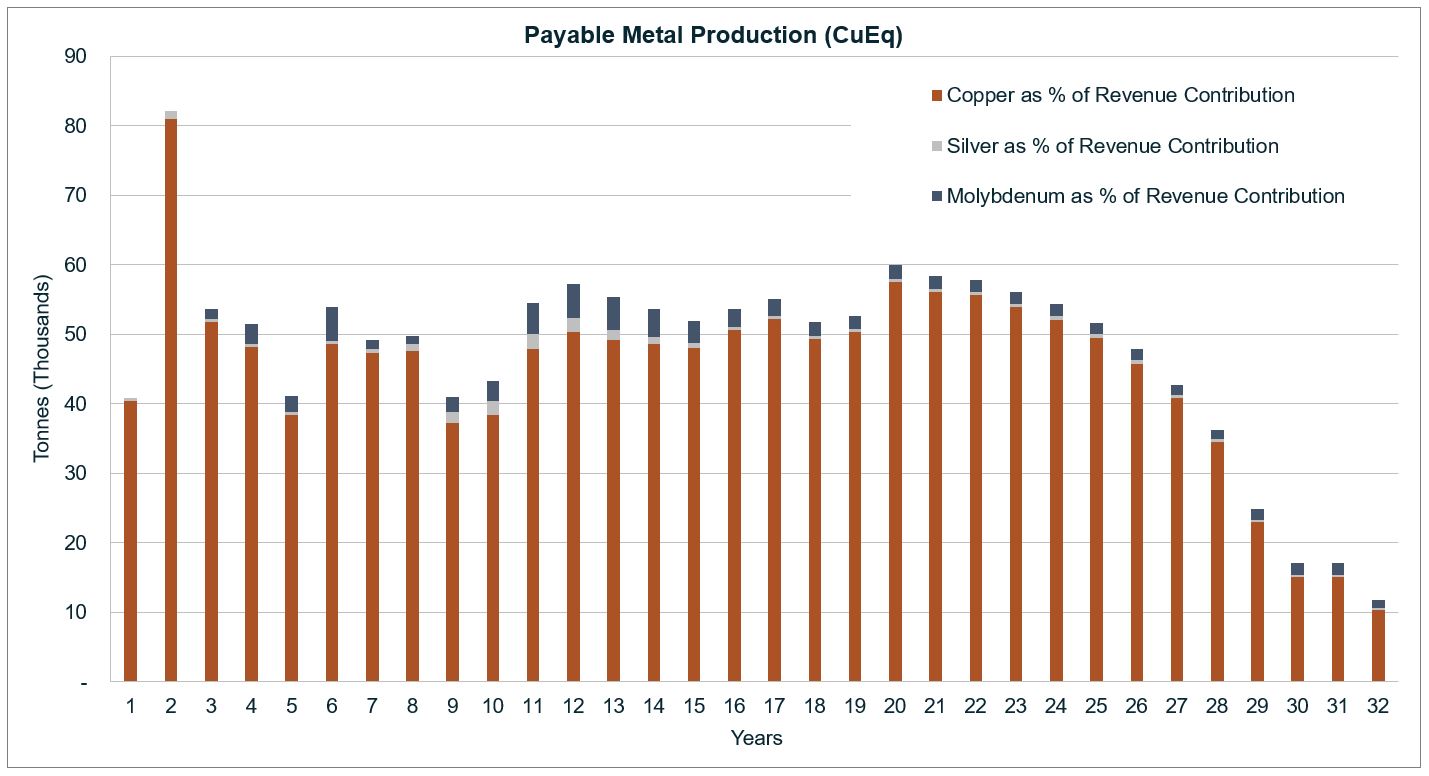
- Long life production profile: Average anticipated payable production during active miningi of 51,100 copper equivalent ("CuEq")ii tonnes per year ("tpa"), with peak production of 82,100 tonnes CuEqii in Year 2. Generating 3.4 billion pounds ("lbs") payable CuEqii metal over the anticipated life of mine (3.2 billion lbs copper, 45.1 million lbs molybdenum, and 9.7 million troy ounces ("oz") silver) (Table 3, Figure 2).
- Low initial capital investment: $798 million, with a construction period of two years (Table 1).
- Competitive operating cost profile: Average life-of-mine ("LOM") production cash costsiii of $1.67/lb copper and all-in sustaining costsiii ("AISC") of $1.85/lb copper (Table 3).
- Favourable strip ratio: Average open pit strip ratio of 1:1.2 due to the nature of the near-surface breccia mineralization that allows sequencing of high-grade production.
- High metallurgical recoveries: Over 94% average copper recovery from sulphide material, producing high-quality clean concentrates.
- Enhanced environmental, social, and governance ("ESG") practices: Dry stack tailings to reduce water requirements and environmental footprint as well as utilization of renewable solar power to reduce emissions.
- Updated Mineral Resource Estimate: An updated MRE is the basis for the PEA. Measured and Indicated resources are 421.9 million tonnes ("Mt") at an average grade of 0.45% copper for a contained 4.2 billion pounds of copper.
- Exploration upside: The mineral resource remains open at depth and laterally, as highlighted by the intersection of massive sulphides beneath the Copper Prince breccia (see news release dated January 17, 2023). In addition, there are over 400 breccia occurrences mapped at surface, 35 drill-tested and 17 included in this MRE, as well as additional porphyry potential.
Zach Allwright, VP Projects and Evaluations, stated, "The outcome of the PEA demonstrates the potential for Copper Creek to become a significant source of U.S. domestic copper production. The study is underpinned by empirical data, acquired through extensive geological and geotechnical assessments, comprehensive metallurgical test work, first principles costing and diligent schedule optimization. This base case forms a foundation on which the Company can continue to add value through resource expansion, new discoveries on the property, the potential to add a gold by-product and various opportunities to increase the production capacity."
* The metrics presented in this news release are based on a PEA that includes an economic analysis of the potential viability of Mineral Resources. Mineral Resources that are not Mineral Reserves do not have demonstrated economic viability. This PEA is preliminary in nature, includes Inferred Mineral Resources that are considered too speculative geologically to have the economic considerations applied to them that would enable them to be categorized as Mineral Reserves, and there is no certainty the PEA will be realized. See "Qualified Person and NI 43-101" below. For reference i, ii, and iii, please refer to endnotes at the end of the document.
Conference Call and Webcast
Investors, media and the public are invited to join the conference call and webcast, during which management will discuss the result of the Copper Creek PEA.
- Thursday, May 4, 2023, at 1:30pm PT (4:30pm ET)
- Toll-free in U.S. and Canada: +1 (800) 319-4610
- All other callers: +1 (604) 638-5340
- Webcast: https://services.choruscall.ca/links/faradaycopper202305.html
- Webcast replay: Available on the Company's website for one year and by phone at +1 (855) 669-9658 or (604) 674-8052 for three months. Please enter passcode 3013#
PEA Overview
The 2023 PEA outlines a low initial capital project that processes approximately 345 Mt of mill feed material from a combined open pit and underground operation. The PEA contemplates a 30,000 tonnes per day ("tpd") conventional flotation process plant producing high-quality copper and molybdenum concentrates, with silver by-product credits. The PEA also captures value from an additional 20 Mt of oxide material sourced from pre-strip mining and processed via a heap leach facility ("HLF") utilizing solvent extraction and electrowinning ("SXEW"), further supporting a rapid payback on initial capital. The PEA does not incorporate any results from the Phase II drill program, which is currently ongoing and expected to conclude near the end of the second quarter of 2023.
Payback of initial capital is expected to occur in Year 4, with the post-tax cash flows funding the expansionary capital, which includes the addition of a molybdenum circuit and development of the underground footprint, both of which commence in Year 3 (Figure 1, Table 1 & Table 13).
Table 1: PEA Economic Highlights
| Base Case Economics | Unit | LOM |
| Post-tax NPV(7%) | $ millions | $713 |
| Post-tax IRR | % | 15.6% |
| Post-tax Payback Period | Years | 4.1 |
| NPV / Initial Capital | Ratio | 0.9 |
| Initial Capital | $ millions | $798 |
| Sustaining and Expansion Capital | $ millions | $1,689 |
| Closure and Reclamation | $ millions | $170 |
| Economic Assumptions | ||
| Copper | $/lb | $3.80 |
| Molybdenum | $lb | $13.00 |
| Silver | $/oz | $20.00 |
| Financial Metrics a | ||
| Annual Revenue | $ millions | $428 |
| Annual Operating Costs | $ millions | $210 |
| Annual EBITDA b | $ millions | $218 |
| Annual Cash Flow (post-tax) | $ millions | $141 |
Notes to Table 1:
a Averages based on active mining during Years 1 - 29.
b EBITDA is a financial performance measure with no standardized definition under IFRS, defined as "earnings before interest, taxes, depreciation and amortization".
Table 2: Pre-Tax NPV Contributions
| Pre-Tax NPV Contributions | $ million |
| Mill Initial Capital | ($640) |
| Open Pit | $977 |
| Underground | $509 |
| Total | $846 |
| Standalone Open Pit a | $337 |
Notes to Table 2:
a Standalone open pit includes mill initial capital.
Table 3: PEA Operating Highlights
| Operating Statistics | Unit | Average LOM |
| Mine Life a | Years | 32 |
| Tonnes Milled b | ktpa | 10.8 |
| Open Pit Strip Ratio | Ratio | 1.2 |
| Payable Production (per year) c, d | ||
| Copper | Million lbs | 106 |
| Molybdenum | Million lbs | 1.4 |
| Silver | Thousand oz | 324.6 |
| CuEq ii | Kt | 51.1 |
| Costs (by-product) iii | ||
| LOM Production Cash Costs | $/Cu lb | $1.67 |
| LOM All-in Sustaining Costs | $/Cu lb | $1.85 |
Notes to Table 3:
a Mine life includes active mining (Year 1 - 29) and final processing of stockpiles (Year 30 - 32)
b Tonnes milled are exclusive of oxide and represent the average over the 32-year life of mine.
c Average annual production considers the period of active mining during Years 1 - 29, Year 30 - 32 includes processing of stockpiles only.
d Based on payability in concentrate of 96.5%, 95% and 98.5% for copper, silver, and molybdenum, respectively. Copper cathode payability of 98% is applied.
Table 4: Economic Sensitivity
| Parameter | Unit | PEA | Alternative Copper Prices a | |
| Copper Price | $/lb | $3.80 | $4.25 | $5.00 |
| Molybdenum Price | $/lb | $13.00 | $13.00 | $13.00 |
| Silver Price | $/oz | $20.00 | $20.00 | $20.00 |
| Post-Tax NPV(7%) | $ millions | $713 | $1,144 | $1,843 |
| Post-Tax NPV(8%) | $ millions | $566 | $951 | $1,576 |
| Post-Tax IRR | % | 15.6% | 21.0% | 29.6% |
| Post-Tax Payback Period | Years | 4.1 | 2.9 | 2.1 |
Notes to Table 4:
a An increase of $10/lb or $5/oz in molybdenum or silver price assumptions increases the post-tax NPV(7%)by approximately $129 million or $15 million, respectively.
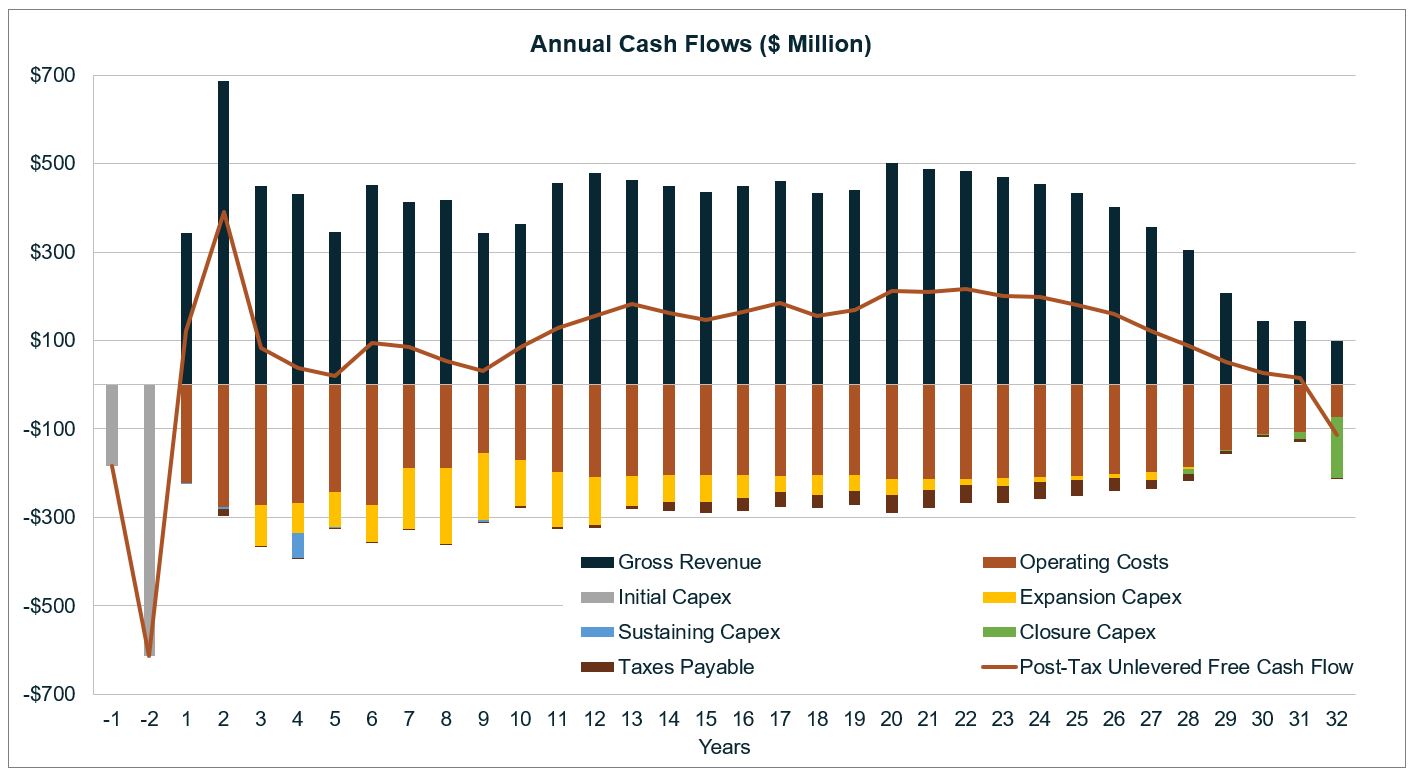
Note to Figure 1: Table 13 provides the amounts used to generate Figure 1. Total operating costs above are inclusive of royalties and offsite charges.
Figure 2: Copper Equivalent Payable Metal Production
Design and Production Profile Overview
The open pit and underground mine plans were developed by SRK Consulting Inc. ("SRK"). Future mining is expected to be by contractor-operated conventional truck and shovel method at surface and during underground development (pre-production), transitioning to owner-operated block caving underground method to achieve a base annual mill feed rate of 11.0 Mt (30,000 tpd). Surface mining provides mill feed until Year 11. A four-year open pit ramp down coincides with the underground production ramp-up, achieving steady state production by Year 12 and continuing until Year 29. Current mine plan optimization has applied an open pit stockpiling strategy whereby low-grade material mined from the pits would be stockpiled and processed as supplementary mill feed or fed to the mill at the end of the mine life. The low-grade stockpile peaks at 56.5 Mt, 20.0 Mt of which would be processed as supplementary feed between Years 7 and 11, and the remaining 36.5 Mt would be processed between Years 28 and 32.
The base annual throughput would be primarily of sulphide material, with some transitional material mined from the open pits. Oxide material recovered near surface in the early years of the anticipated mine life would be segregated and processed separately in a heap leach facility, in addition to the 11.0 Mt base annual throughput (Figure 3).
Figure 3: Total Processed Material by Material Type
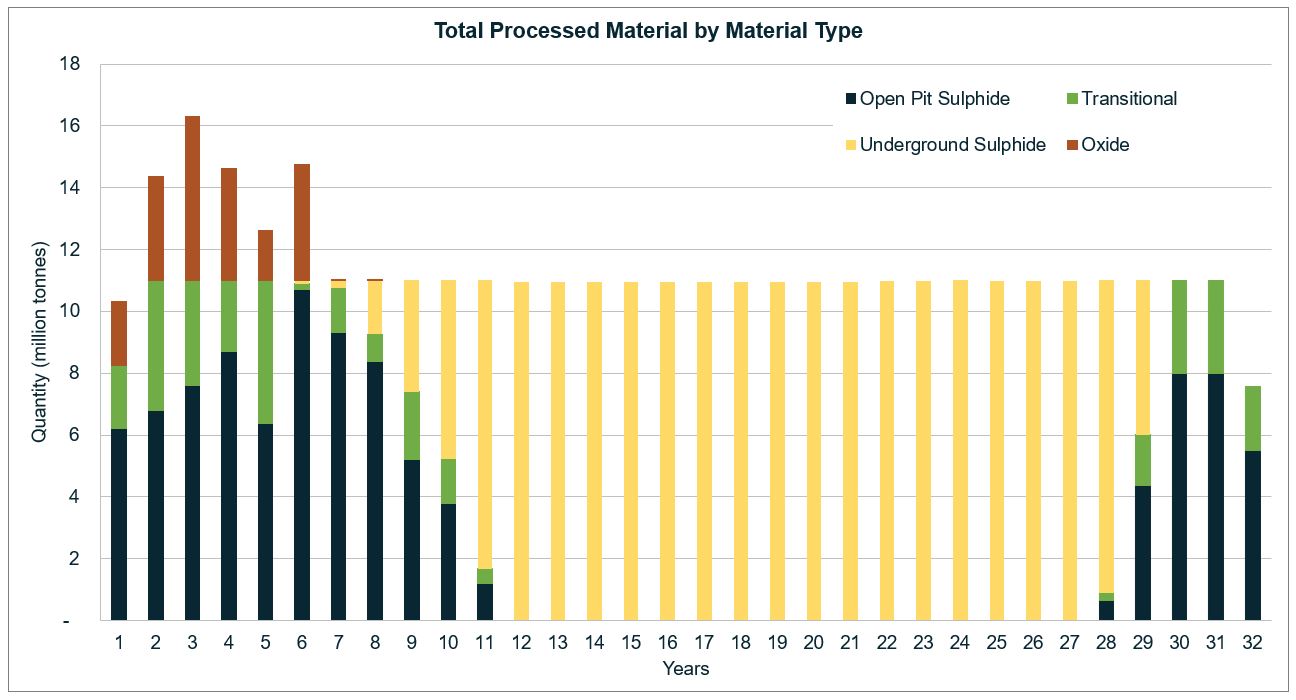
Figure 4: Mine Design Overview (isometric view looking northeast)
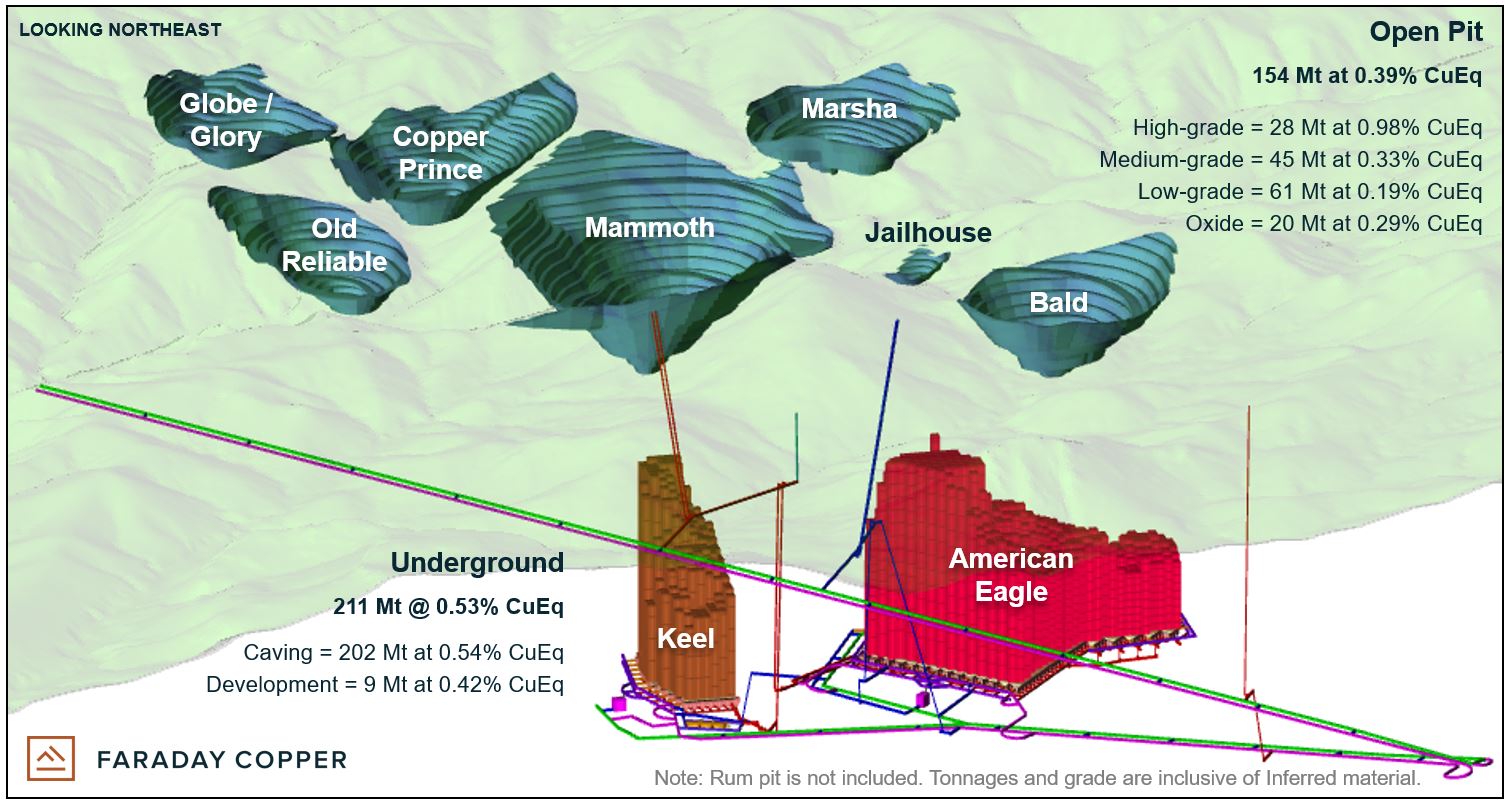
Note to Figure 4: Mammoth pit includes the Mammoth and Childs-Aldwinkle breccias, and the Copper Prince pit includes numerous breccias such as the Copper Prince, Copper Giant, Copper Duchess, and Copper Knight.
Figure 5: Mined Material by Period
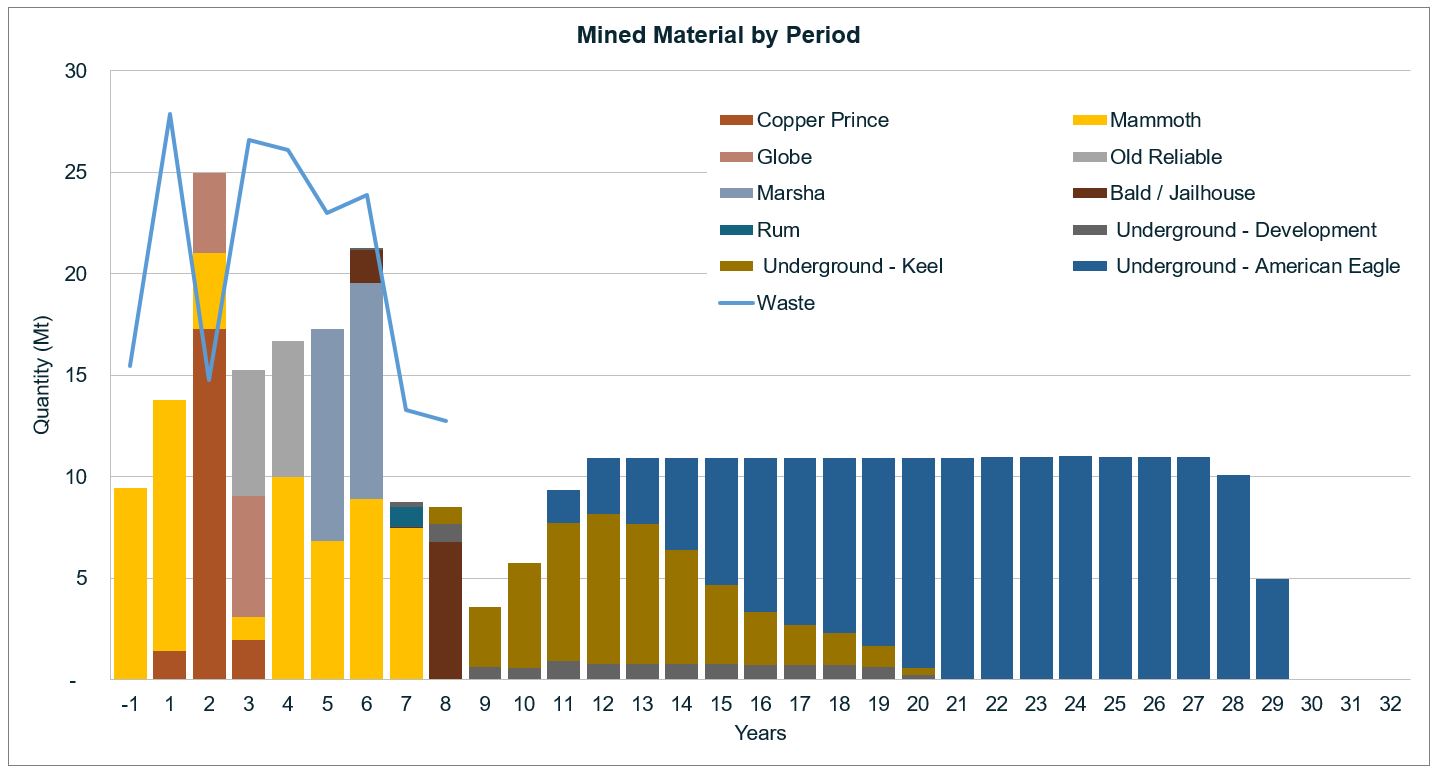
Note to Figure 5: All material reflected in this chart is mineralized mill feed unless denoted as 'Waste'.
Open Pit Mine Design and Schedule
Open pit mine designs utilized the updated MRE. The resource model was imported into Minesight mine planning software where a Lerch Grossman algorithm was applied to the model to determine possible open pit limits. Each open pit area was assessed across a series of revenue factors to target the optimal balance of NPV contribution, footprint requirements and strip ratio. The results of the assessment culminated in pit shell selections that are reflective of an average revenue factor of 0.81 ($3.06/lb copper). Upon selection of discrete pit shells for each pit area, a full pit design was completed in alignment with geotechnical parameters developed as part of the PEA. All pit designs incorporated ramp placement, haulage networks, pit phasing and backfill opportunities.
Open pits include Mammoth, the largest open pit, and several smaller satellite pits. Mammoth would be mined in three phases, generally from the northwest to the southeast, while each of the satellite pits would be a single phase. Table 5 summarizes the pit inventories.
Table 5: Inventory by Pit
Processed Tonnage (Mt) | Processed Grade (% Copper) | Waste Tonnage | Strip Ratio | |||
| Open Pit a | Sulphide/Transitional | Oxides | Sulphide/Transitional | Oxides | ||
| Copper Prince | 20.7 | 5.9 | 0.45 | 0.36 | 11.5 | 0.43 |
| Globe | 9.9 | 2.7 | 0.40 | 0.37 | 5.0 | 0.40 |
| Old Reliable | 12.9 | 4.0 | 0.36 | 0.20 | 10.9 | 0.65 |
| Mammoth | 59.9 | 2.9 | 0.37 | 0.25 | 109.6 | 1.75 |
| Marsha | 21.1 | 4.3 | 0.24 | 0.25 | 3.2 | 0.12 |
| Bald/Jailhouse | 8.5 | 0.0 | 0.48 | 0.16 | 41.7 | 4.92 |
| Rum | 1.0 | 0.0 | 0.73 | 0.44 | 1.0 | 1.04 |
| Total | 133.9 | 19.8 | 0.37 | 0.29 | 182.9 | 1.19 |
Notes to Table 5:
a Numbers may not sum due to rounding.
Mineralization is hosted in three material types: sulphide, transitional and oxide. Sulphide and transitional material would be processed at the flotation plant, while oxide material would be heap leached.
Table 6: Open Pit Summary - Material Processed by Year
Units | Total | 1 | 2 | 3 | 4 | 5 | 6 | 7 | 8 | 9 | 10 | 11 | 28-32 | |
| Total Processed Pit Material | Mt | 153.7 | 10.3 | 14.3 | 16.3 | 14.6 | 12.6 | 14.7 | 10.8 | 9.3 | 7.4 | 5.2 | 1.7 | 36.5 |
| Sulphides and Transitional | Mt | 133.9 | 8.3 | 11.0 | 11.0 | 11.0 | 11.0 | 10.9 | 10.8 | 9.3 | 7.4 | 5.2 | 1.7 | 36.5 |
%Cu | 0.37 | 0.50 | 0.78 | 0.38 | 0.44 | 0.39 | 0.42 | 0.48 | 0.49 | 0.29 | 0.17 | 0.17 | 0.17 | |
| Oxides |