from IBC Advanced Alloys Corp. (isin : CA44923T8683)
IBC Advanced Alloys Reports Financial Results for the Quarter and Year Ended June 30, 2023
Highlights of the Quarter and Year as Compared to the Prior-Year Periods
(Unless otherwise noted, all financial amounts in this news release are expressed in U.S. dollars.)
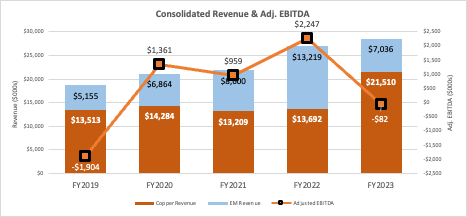
- Sales for the year increased by 6% to $28.5 million and rose by 15% in the quarter to $7.4 million.
- Copper Alloys division sales rose by 51.3% in the quarter and 57.1% in the year over the comparable prior-year periods. Engineered Materials ("EM") division sales declined 32.4% in the quarter and 46.8% in the year as compared to the prior-year periods.
- Consolidated adjusted earnings before interest, taxes, depreciation, and amortization ("Adjusted EBITDA") 1 were ($404,000) and ($89,000) in the quarter and year, respectively. IBC booked a loss for the quarter and year of $3 million ($0.03 / share) and $5.9 million ($0.06), respectively.
FRANKLIN, ID / ACCESSWIRE / October 25, 2023 / IBC Advanced Alloys Corp. (" IBC " or the " Company ") ( TSXV:IB)(OTCQB:IAALF ) announces its financial results for the quarter and year ended June 30, 2023.
Consolidated sales grew in the quarter and year compared to the comparative periods. The sales and profitability gains in the Copper Alloys division were offset by weaker performance in the EM division.
"The Copper Alloys division continues to show strong revenue and performance growth, which helped to drive the division's higher gross margin and profitability for the year," said Mark A. Smith, Chairman and CEO of IBC. "While cost of materials has risen across our industry, Copper Alloys has been able to weather those headwinds largely as a result of the cost savings and greater production efficiencies gained from the consolidation and modernization of our vertical integrated foundry in Indiana."
"Demand for beryllium-aluminum products in defense markets remains robust, as evidenced by IBC's recent purchase order from Lockheed Martin for $7.38 million for components for the F-35 aircraft," said Mr. Smith. "Commercial market demand for beryllium-aluminum components remains significantly softer as compared to earlier periods, and that impacts revenue at the Engineered Materials division. Also, while yields at the division have improved, they remain sub-optimal, and that further impacts our profitability. We are exploring strategic options regarding the Engineered Materials division with potential partners, investors, and others, including potential joint ventures, a restructuring, a sale, or other options."
Consolidated Results
SELECTED RESULTS: Consolidated Operations ($000s) | |||||||||||||||||
Quarter Ended 6-30-2023 | Year Ended6-30-2023 | Year Ended 6-30-2022 | Year Ended 6-30-2022 | ||||||||||||||
Revenue | $ | 7,369 | $ | 6,419 | $ | 28,547 | $ | 26,911 | |||||||||
Change | 14.8 | % | 6.1 | % | |||||||||||||
Operating income (loss) 1 | $ | (2,284 | ) | $ | (662 | ) | $ | (3,422 | ) | $ | 257 | ||||||
Adjusted EBITDA 1 | $ | (404 | ) | $ | 91 | $ | (89 | ) | $ | 2,247 | |||||||
Income (loss) for the period | $ | (3,013 | ) | $ | (1,183 | ) | $ | (5,932 | ) | $ | (1,132 | ) | |||||
Income (loss) per share | (0.03 | ) | (0.01 | ) | (0.06 | ) | 0.01 | ||||||||||
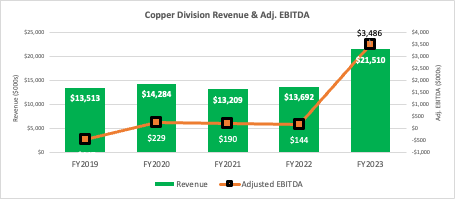
Copper Alloys Division
The Copper Alloy division revenue was driven primarily by increased demand from customers in the electronics sector that are manufacturing products related to the rapidly growing network connectivity of consumer goods and the transition to 5G networks. The division's gross margin also strengthened in the year to 23.1%, from 14.9% in the prior year. Operating performance has remained strong as the division continues to take advantage of lower costs and greater efficiencies resulting from its consolidated foundry and forge operations.
SELECTED RESULTS: Copper Alloys Division ($000s) | |||||||||||||||||
| Quarter Ended 6-30-2023 | Quarter Ended6-30-2022 | Year Ended6-30-2023 | Year Ended6-30-2022 | ||||||||||||||
Revenue | $ | 5,476 | $ | 3,619 | $ | 21,511 | $ | 13,692 | |||||||||
Change | 51.3 | % | 57.1 | % | |||||||||||||
Operating income (loss) 1 | $ | 696 | $ | 103 | $ | 2,926 | $ | (505 | ) | ||||||||
Adjusted EBITDA 1 | $ | 835 | $ | 430 | $ | 3,480 | $ | 144 | |||||||||
Income (loss) for the period | $ | 438 | $ | (38 | ) | $ | 2,107 | $ | (317 | ) | |||||||
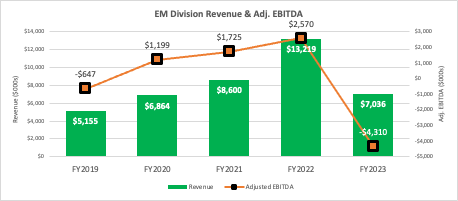
Engineered Materials Division
Engineered Materials has continued to experience lower demand for commercial beryllium-aluminum products as well as less-than-optimal yields. This is reflected in lower sales and current-period operating losses:
SELECTED RESULTS: Engineered Materials Division ($000s) | |||||||||||||||||
| Quarter Ended 6-30-2023 | Quarter Ended6-30-2022 | Year Ended6-30-2023 | Year Ended6-30-2022 | ||||||||||||||
Revenue | $ | 1,893 | $ | 2,800 | $ | 7,036 | $ | 13,219 | |||||||||
Change | (32.4 | %) | (48.8 | ) | |||||||||||||
Operating income (loss) 1 | $ | (2,600 | ) | $ | (558 | ) | $ | (5,390 | ) | $ | 1,444 | ||||||
Adjusted EBITDA 1 | $ | (2,335 | ) | $ | (213 | ) | $ | (4,310 | ) | $ | 2,570 | ||||||
Income (loss) for the period | $ | (4,316 | ) | $ | (614 | ) | $ | (7,362 | ) | $ | 1,132 | ||||||
Full results can be seen in the Company's financial statements and management's discussion and analysis ("MD&A"), available at Sedar.ca and on the Company's website at https://ibcadvancedalloys.com/investors-center/ .
NON-IFRS MEASURES
To supplement its consolidated financial statements, which are prepared and presented in accordance with IFRS, IBC uses "operating income (loss)" and "Adjusted EBITDA", which are non-IFRS financial measures. IBC believes that operating income (loss) helps identify underlying trends in the business that could otherwise be distorted by the effect of certain income or expenses that the Company includes in loss for the period, and provides useful information about core operating results, enhances the overall understanding of past performance and future prospects, and allows for greater visibility with respect to key metrics used by management in financial and operational decision-making. The Company believes that Adjusted EBITDA is a useful indicator for cash flow generated by the business that is independent of IBC's capital structure.
Operating income (loss) and Adjusted EBITDA should not be considered in isolation or construed as an alternative to loss for the period or any other measure of performance or as an indicator of our operating performance. Operating income (loss) and Adjusted EBITDA presented here may not be comparable to similarly titled measures presented by other companies. Other companies may calculate similarly titled measures differently, limiting their usefulness as comparative measures to IBC's data.
OPERATING INCOME (LOSS)
Operating income (loss) represents income or loss for the quarter, excluding foreign exchange loss, interest expense, interest income, other income (expense) and income taxes that the Company does not believe are reflective of its core operating performance during the periods presented. A reconciliation of the quarter and year-to-date loss to operating income (loss) follows:
Three months ended June 30 | 2023 | 2022 | |||||||
| ($000s) | ($000s) | ||||||||
Loss for the period | (3,013 | ) | (1,183 | ) | |||||
Foreign exchange (gain) loss | (8 | ) | 27 | ||||||
Interest expense | 585 | 819 | |||||||
Impairment Loss | 1,575 | -- | |||||||
Loss on disposal of assets | -- | (245 | ) | ||||||
(Gain) on revaluation of derivative | (3 | ) | (83 | ) | |||||
Other income | (1,395 | ) | -- | ||||||
Income tax expense (recovery) | (5 | ) | 3 | ||||||
Operating income | (2,284 | ) | (662 | ) | |||||
Year ended June 30 | 2023 | 2022 | |||||||
| ($000s) | ($000s) | ||||||||
Loss for the period | (5,932 | ) | (1,132 | ) | |||||
Foreign exchange (gain) loss | (13 | ) | 33 | ||||||
Interest expense | 2,427 | 1,566 | |||||||
Impairment Loss | 1,575 | -- | |||||||
Loss on disposal of assets | -- | (137 | ) | ||||||
(Gain) on revaluation of derivative | (72 | ) | (83 | ) | |||||
Other income | (1,408 | ) | (18 | ) | |||||
Income tax expense | 1 | 28 | |||||||
Operating income (loss) | (3,422 | ) | 257 | ||||||
ADJUSTED EBITDA
Adjusted EBITDA represents our income (loss) for the period before interest, income taxes, depreciation, amortization, and share-based compensation. A reconciliation of the quarter and year-to-date loss to Adjusted EBITDA follows:
Year ended June 30 | 2023 | 2022 | |||||||
| ($000s) | ($000s) | ||||||||
Loss for the period | (3,013 | ) | (1,183 | ) | |||||
Income tax expense (recovery) | (5 | ) | 3 | ||||||
Interest expense | 565 | 819 | |||||||
(Gain) on revaluation of derivative | (3 | ) | (83 | ) | |||||
Impairment Loss | 1,575 | -- | |||||||
Depreciation & amortization | 416 | 410 | |||||||
Stock-based compensation expense (non-cash) | 61 | 125 | |||||||
Adjusted EBITDA | (404 | ) | 91 | ||||||
Year ended June 30 | 2023 | 2022 | |||||||
| ($000s) | ($000s) | ||||||||
Loss for the period | (3,013 | ) | (1,183 | ) | |||||