from Namibia Critical Metals Inc. (CVE:NMI)
Lofdal Heavy Rare Earth Project: Update of Mineral Resource Estimate after Completion of 2023 Infill Drilling
HALIFAX, NS / ACCESSWIRE / April 9, 2024 / Namibia Critical Metals Inc. ("Namibia Critical Metals" or the "Company" or "NCMI") (TSXV:NMI)(OTCQB:NMREF) is pleased to announce an updated NI 43-101 Mineral Resource Estimate for the large-scale "Lofdal 2B-4" heavy rare earth project.
The Company conducted a two-stage infill drilling campaign for the subprojects Area 4 and Area 2B (press releases of 2 February 2024, 6 December 2023 and 31 January 2023) with the purpose of increasing the confidence of the resources for the planned open pits of Area 4 and Area 2B. The MSA Group provided an NI 43-101 Mineral Resource Estimate which includes the new data.
Highlights of the mineral resource update include:
- Contained tonnages of Dysprosium and Terbium - the most valuable heavy rare earth elements - amount to 4,503 tonnes Dysprosium oxide and 693 tonnes Terbium oxide in the combined Measured and Indicated Resource categories which represents an increase of 11% and 12%, respectively, compared to the previous Mineral Resource Statement (filed on SEDAR on 30 June 2021);
- 38% increase in contained Dysprosium oxide and 39% increase in contained Terbium oxide in the Inferred Resources for the combined Area 4 and Area 2B deposits;
- 31% increase in contained Total Rare Earth Oxide (TREO1) tonnage in the combined Measured and Indicated Resource categories from 72,680 tonnes to 93,731 tonnes;
- The combined Measured and Indicated Mineral Resources increased from 44.8 million tonnes at 0.17% TREO to 58.5 million tonnes at 0.16% TREO for the combined Area 4 and Area 2B deposits based on the same cut-off of 0.1 % TREO as in the previous PEA (filed on SEDAR on 30 June 2021);
Darrin Campbell, President of Namibia Critical Metals stated:
"We are very pleased with the continued success of our development approach at Lofdal. With just under 11,000 meters of drilling last year, we have increased the overall contained rare earth tonnage by an impressive 37%. The Measured and Indicated resource shells at Lofdal 2B and 4 contain over 4,500 tonnes Dysprosium oxide and over 690 tonnes Terbium oxide which clearly establishes Lofdal as a globally significant heavy rare earth deposit. The updated resource will be incorporated into our Pre-Feasibility Study for "Lofdal 2B-4" currently under way and expected to be completed in Q3 2024"
1"TREO" refers to total rare earth oxides plus yttrium oxide; "HREO" refers to heavy rare earth oxides plus yttrium oxide; "heavy rare earths" as used in all Company presentations comprise europium (Eu), gadolinium (Gd), terbium (Tb), dysprosium (Dy), holmium (Ho), erbium (Er), thulium (Tm), ytterbium (Yb), lutetium (Lu) and yttrium (Y). Light rare earths comprise lanthanum (La), cerium (Ce), praseodymium (Pr), neodymium (Nd) and samarium (Sm).
Infill drilling program at Area 2B and Area 4 Deposit
The final drill program was worked out by the Company with support by The MSA Group to increase the level of resource categories as required for the PFS for the expanded project "Lofdal 2B-4".
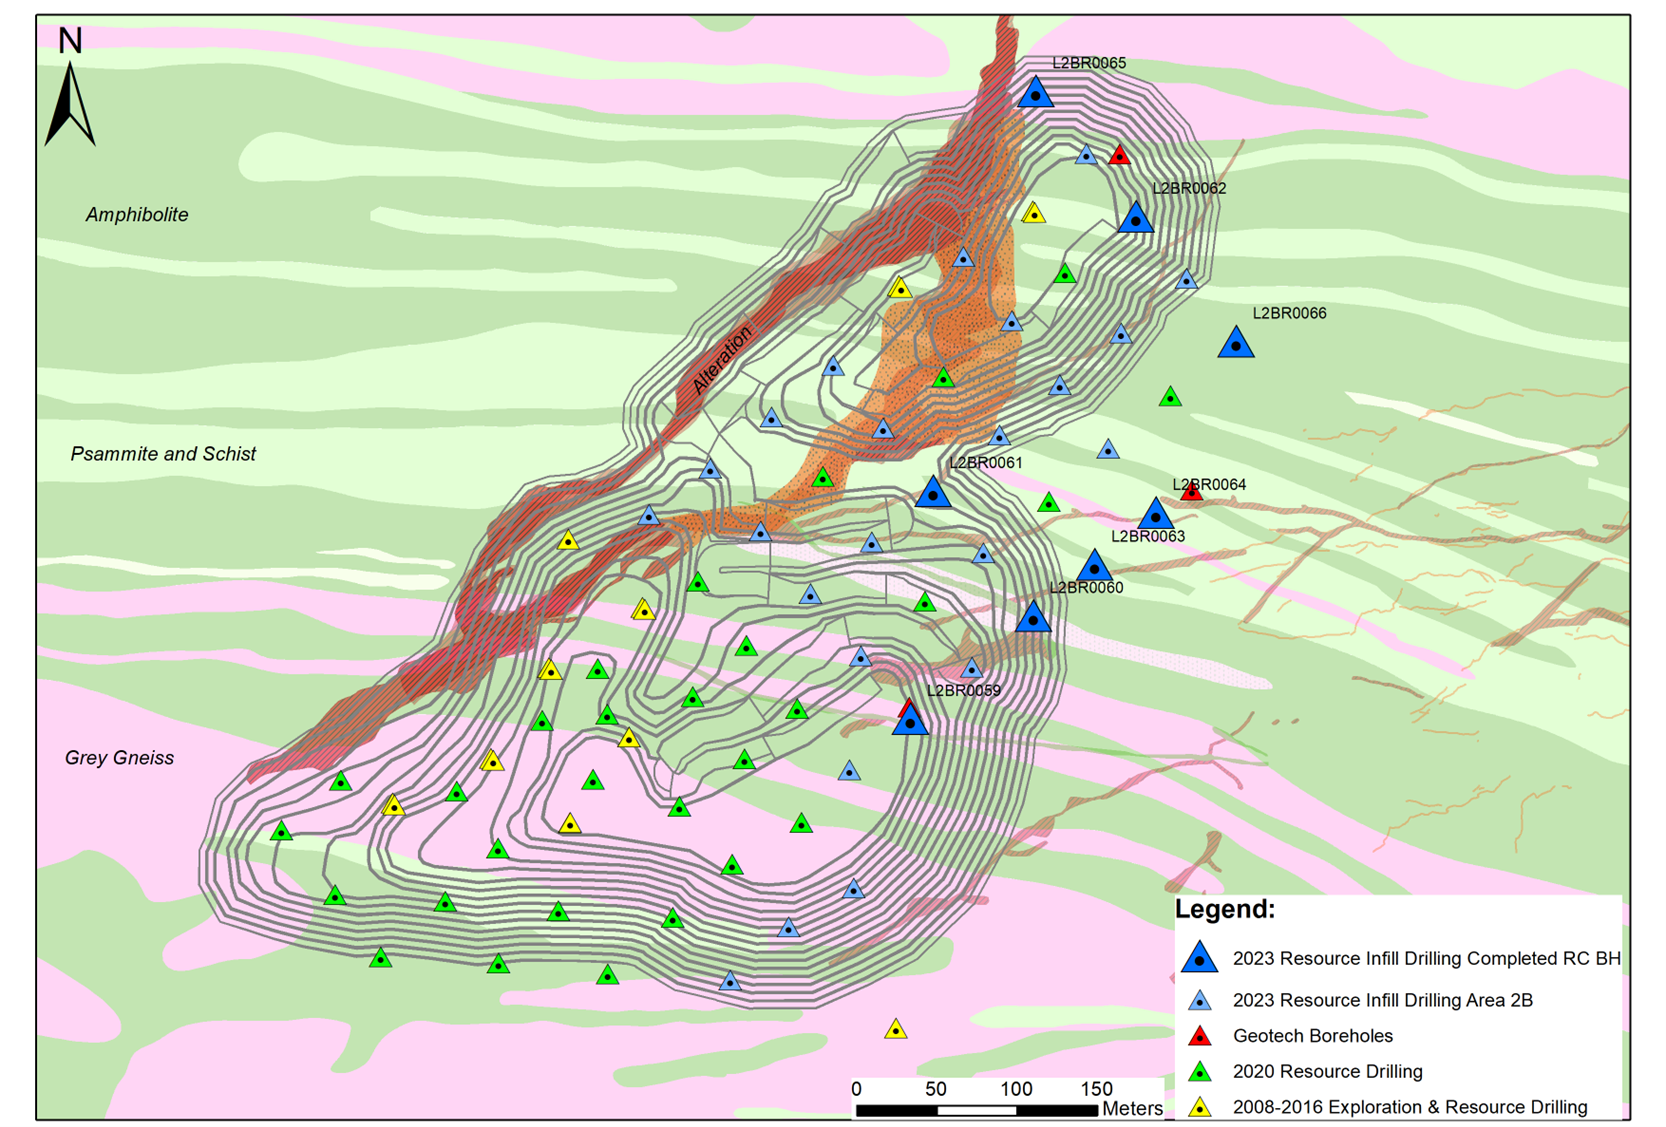
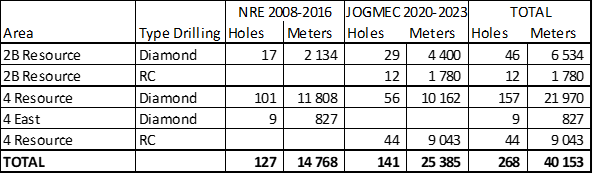
Resource infill drilling was completed in November 2023 which brought total drilling for Area 2B and Area 4 to 268 holes with a total of 40,153 m of both, diamond core drilling (DC) and reverse circulation drilling (RC), see table below:
Sampling, analysis and QAQC
Samples were collected at the drill rig's cyclone ("A-sample") and submitted to Actlab's preparatory laboratory in Windhoek, Namibia, in batches of 200 to 300 samples. The samples were dried and crushed to 2 mm, split using a riffle splitter and pulverised to 105 µm. Pulverised sub-samples were homogenised in a stainless-steel riffle splitter and a 15 g sample and duplicate were drawn for analysis. The pulverised sample aliquots were shipped to the ISO/IEC 17025 accredited Actlabs analytical facility in Ancaster, Ontario, Canada. The samples were assayed using lithium metaborate-tetraborate fusion and Inductively Coupled Plasma Mass Spectrometry (ICP-MS). Actlab's analytical code "8-REE" includes 45 trace elements, 10 major oxides, Loss on Ignition, and mass balance.
The samples were subjected to a quality assurance and quality control (QAQC) program consisting of the insertion of blank samples, field duplicates and certified reference materials at Lofdal and the preparation of a laboratory duplicate at the sample preparation facility in Windhoek.
The Qualified Person, Dr Scott Swinden, is satisfied that the assay results are of sufficient accuracy and precision for use in the future update of the Mineral Resource Estimation.
Mineral Resource Statement
The Mineral Resource was estimated using the Canadian Institute of Mining, Metallurgy and Petroleum (CIM) Best Practice Guidelines and is reported in accordance with the 2014 CIM Definition Standards, which have been incorporated by reference into National Instrument 43-101 - Standards of Disclosure for Mineral Projects (NI 43-101). The Mineral Resource is classified into the Measured, Indicated and Inferred categories and is reported at a cut-off grade of 0.1% total rare earth oxides (TREO). A summary of the Mineral Resource estimates is shown in Table 1 for Area 4 and Table 2 for Area 2B.
Table 1: Area 4 Mineral Resource Estimate above 0.1% TREO* cut-off grade
Category | Tonnes | TREO* | HREO** | LREO*** | Dy2O3 | TREO* |
Measured | 6.6 | 0.21 | 0.14 | 0.07 | 130 | 13.7 |
Indicated | 49.2 | 0.15 | 0.07 | 0.08 | 69 | 75.7 |
Measured & Indicated | 55.8 | 0.16 | 0.08 | 0.08 | 76 | 89.4 |
Inferred | 10.5 | 0.14 | 0.06 | 0.08 | 58 | 15.0 |
Notes:
- All tabulated data have been rounded and as a result minor computational errors may occur.
- Mineral Resources, which are not Mineral Reserves, have no demonstrated economic viability.
- *TREO = Total Rare Earth Oxides and includes Y2O3
- **HREO = Total Heavy Rare Earth Oxides and includes Y2O3
- ***LREO = Total Light Rare Earth Oxides
Table 2: Area 2B Mineral Resource Estimate above 0.1% TREO* cut-off grade
Category | Tonnes | TREO* | HREO** | LREO*** | Dy2O3 | TREO* |
Indicated | 2.7 | 0.16 | 0.09 | 0.07 | 97 | 4.4 |
Inferred | 4.4 | 0.15 | 0.07 | 0.08 | 75 | 6.6 |
Notes:
- All tabulated data have been rounded and as a result minor computational errors may occur.
- Mineral Resources, which are not Mineral Reserves, have no demonstrated economic viability.
- *TREO = Total Rare Earth Oxides and includes Y2O3
- **HREO = Total Heavy Rare Earth Oxides and includes Y2O3
- ***LREO = Total Light Rare Earth Oxides
The Mineral Resource is presented at a variety of cut-off grades as shown in Error! Reference source not found. (Measured and Indicated) and Error! Reference source not found. (Inferred) for Area 4, and Error! Reference source not found. (Indicated) and Error! Reference source not found. (Inferred) for Area 2B. The grade-tonnage curves (Figure 3) underline the large upside potential of the Lofdal project by potentially beneficiating lower grade resources, likely by sorting technologies, in future.
Table 3: Area 4, Measured and Indicated Resources Grade-Tonnages
Cut-off TREO % | Tonnes | TREO* | HREO** | LREO** | Dy2O3 ppm | TREO |
0.10 | 55.8 | 0.16 | 0.08 | 0.08 | 76 | 89.4 |
0.15 | 20.4 | 0.23 | 0.13 | 0.10 | 120 | 46.5 |
0.20 | 8.4 | 0.31 | 0.20 | 0.11 | 186 | 26.0 |
0.25 | 4.2 | 0.40 | 0.29 | 0.11 | 262 | 16.8 |
0.30 | 2.6 | 0.48 | 0.38 | 0.10 | 333 | 12.4 |
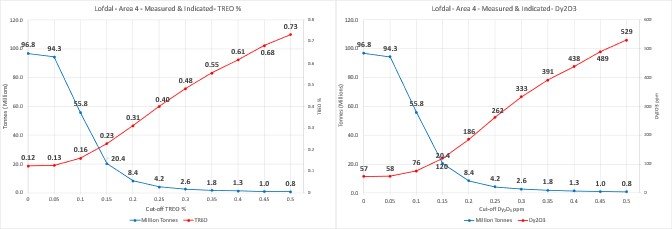
Table 4: Area 4, Inferred Resources Grade-Tonnages
Cut-off TREO % | Tonnes | TREO* | HREO** | LREO*** | Dy2O3 ppm | TREO |
0.10 | 10.5 | 0.14 | 0.06 | 0.08 | 58 | 15.0 |
0.15 | 3.4 | 0.18 | 0.08 | 0.11 | 76 | 6.3 |
0.20 | 0.7 | 0.24 | 0.12 | 0.12 | 118 | 1.7 |
0.25 | 0.2 | 0.30 | 0.20 | 0.09 | 193 | 0.6 |
Notes:
- All tabulated data have been rounded and as a result minor computational errors may occur.
- Mineral Resources, which are not Mineral Reserves, have no demonstrated economic viability.
- *TREO = Total Rare Earth Oxides and includes Y2O3
- **HREO = Total Heavy Rare Earth Oxides and includes Y2O3
- ***LREO = Total Light Rare Earth Oxides
Table 5: Area 2B, Indicated Resources Grade-Tonnages
Cut-off TREO % | Tonnes | TREO* | HREO** | LREO*** | Dy2O3 ppm | TREO |
0.10 | 2.7 | 0.16 | 0.09 | 0.07 | 97 | 4.4 |
0.15 | 1.3 | 0.21 | 0.11 | 0.10 | 117 | 2.7 |
0.20 | 0.6 | 0.25 | 0.12 | 0.13 | 133 | 1.5 |
0.25 | 0.3 | 0.29 | 0.14 | 0.15 | 150 | 0.8 |
Notes:
- All tabulated data have been rounded and as a result minor computational errors may occur.
- Mineral Resources, which are not Mineral Reserves, have no demonstrated economic viability.
- *TREO = Total Rare Earth Oxides and includes Y2O3
- **HREO = Total Heavy Rare Earth Oxides and includes Y2O3
- ***LREO = Total Light Rare Earth Oxides
Table 6: Area 2B, Inferred Resources Grade-Tonnages
Cut-off TREO % | Tonnes | TREO* | HREO** | LREO*** | Dy2O3 ppm | TREO |
0.10 | 4.4 | 0.15 | 0.07 | 0.08 | 75 | 6.6 |
0.15 | 1.6 | 0.20 | 0.09 | 0.11 | 96 | 3.3 |
0.20 | 0.6 | 0.25 | 0.10 | 0.15 | 111 | 1.6 |
0.25 | 0.2 | 0.31 | 0.10 | 0.20 | 115 | 0.8 |
Notes:
- All tabulated data have been rounded and as a result minor computational errors may occur.
- Mineral Resources, which are not Mineral Reserves, have no demonstrated economic viability.
- *TREO = Total Rare Earth Oxides and includes Y2O3
- **HREO = Total Heavy Rare Earth Oxides and includes Y2O3
- ***LREO = Total Light Rare Earth Oxides
The Mineral Resource is reported at a 0.1% TREO cut-off for each individual Rare Earth Oxide (REO) (Error! Reference source not found. for Area 4 and Error! Reference source not found. for Area 2B). Quantities for each individual REO are reported in tonnes (t) at a 0.1% TREO cut-off in Error! Reference source not found. for Area 4 and in Error! Reference source not found. for Area 2B.
Table 7: Area 4 Mineral Resource Estimate above 0.1% TREO* cut-off grade
Class | Tonnes | TREO* | La2O3 | Ce2O3 | Pr2O3 | Nd2O3 | Sm2O3 | Eu2O3 | Gd2O3 | Tb2O3 | Dy2O3 | Ho2O3 | Er2O3 | Tm2O3 | Yb2O3 | Lu2O3 | Y2O3 |
Measured | 6.57 | 0.21 | 173 | 313 | 34 | 124 | 42 | 18 | 81 | 19 | 130 | 28 | 83 | 12 | 76 | 11 | 935 |
Indicated | 49.22 | 0.15 | 217 | 383 | 40 | 145 | 40 | 14 | 55 | 11 | 69 | 14 | 41 | 6 | 36 | 5 | 463 |
M&I | 55.79 | 0.16 | 211 | 374 | 39 | 142 | 40 | 15 | 58 | 12 | 76 | 16 | 46 | 7 | 41 | 6 | 519 |
Inferred | 10.52 | 0.14 | 217 | 389 | 42 | 150 | 40 | 13 | 49 | 9 |