from ROK Resources Inc. (CVE:ROK)
ROK Resources Files Financial Results for the Third Quarter of 2023 & Releases Operational Update
NOT FOR DISTRIBUTION TO THE U.S. NEWSWIRE OR FOR DISSEMINATION IN THE UNITED STATES
REGINA, SK / ACCESSWIRE / November 21, 2023 / ROK Resources Inc. ("ROK" or the "Company") (TSXV:ROK)(TSXV:ROK.WT)(OTCQB:ROKRF) has filed its interim Financial Results and Management Discussion & Analysis for the three and nine months ended September 30, 2023.
Q3 2023 HIGHLIGHTS
- Production up 10% YoY and 17% QoQ: Production averaged 3,858 boepd in the period, representing 10% growth compared to Q3 2022 and 17% growth compared to Q2 2023.
- Outperformed production forecast: Production exceeded the Company's average Q3 2023 forecast of 3,475 boepd by 11%.
- Net Debt reduced by 51% YoY: Net debt reduced from $30.7 million at Q3 2022 to $15.0 million in Q3 2023.
Consistent with previous disclosure, the Company's capital program remained weighted to the second half of 2023, with a focus on Southeast Saskatchewan light oil growth. Total debt has been reduced by over 51% year-over-year, which has provided the Company with the flexibility to allocate development capital across some of the most economic plays in North America.
OPERATIONS UPDATE
In Q3 2023 the Company successfully drilled and completed 6 gross (5.9 net) wells in Southeast Saskatchewan, consisting of 3 gross (2.9 net) Frobisher horizontal wells and 3 gross (2.98 net) Midale horizontal wells. The Company had the 8th best performing Mississippian oil well in Saskatchewan for Q3 2023 with monthly volume of 6,962 bbls and an IP30 of 232 bbls/d.
In Q4 2023 the Company has drilled 3 gross (3 net) Frobisher horizontal wells in Southeast Saskatchewan and 1 gross (0.30 net) Gething gas well in Kaybob Alberta. In December, the Company will drill 2 gross (1.45 net) wells, both unbooked horizontal Frobisher locations in core operating areas.
Current corporate production is approximately 4,000 boepd with 2 gross (2 net) Midale horizontal wells in "clean-up" period post-frac, plus an additional 6 gross (4.75 net) wells forecasted to be on-stream no later than Q1 2024.
OUTLOOK
The Company has had success with early Q3 2023 drilling results and will complete its drilling program in late Q4 2023, a few weeks behind schedule. With operational delays impacting on-stream dates, management expects some wells to begin producing in early Q1 2024. Management will evaluate production results and release a 2024 capital budget and production guidance in Q1 2024.
As a result of uncertainty on production timing of Q4 2023 drilling, exit 2023 production guidance is as follows:
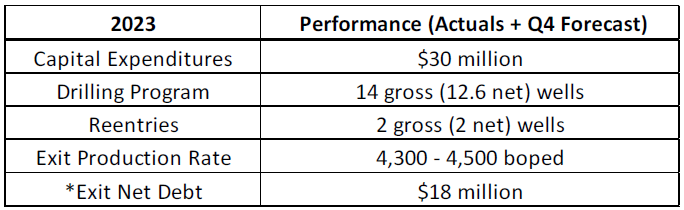
* Before inclusion of any mark-to-market fair value of hedges to be realized in the following 12 months
Financial | Q3 2023 | Q3 2022 | YTD 2023 | YTD 2022 | ||||||||||||
Net income (loss) | (7,752,269 | ) | 10,810,729 | (7,273,545 | ) | 85,559,744 | ||||||||||
Basic ($/share) | (0.04 | ) | 0.05 | (0.03 | ) | 0.52 | ||||||||||
Diluted ($/share) | (0.04 | ) | 0.05 | (0.03 | ) | 0.50 | ||||||||||
Funds flow | 5,303,180 | 13,472,784 | 22,170,046 | 33,052,787 | ||||||||||||
Basic ($/share) | 0.02 | 0.07 | 0.10 | 0.20 | ||||||||||||
Diluted ($/share) | 0.00 | 0.00 | 0.10 | 0.19 | ||||||||||||
Expenditures on property, plant and equipment | 7,580,757 | 11,938,870 | 16,585,543 | 16,441,696 | ||||||||||||
Operating | ||||||||||||||||
Operating Income | ||||||||||||||||
Oil and Natural Gas Sales | 22,144,104 | 26,554,511 | 64,019,554 | 63,386,401 | ||||||||||||
Royalties | (2,931,103 | ) | (4,303,644 | ) | (11,490,495 | ) | (10,185,960 | ) | ||||||||
Operating Expenses | (13,353,260 | ) | (9,926,624 | ) | (32,594,808 | ) | (17,551,783 | ) | ||||||||
Operating Income | 5,859,741 | 12,324,243 | 19,934,251 | 35,648,658 | ||||||||||||
Realized gain on commodity contracts | 563,524 | 1,552,524 | 5,689,069 | 1,788,499 | ||||||||||||
Processing and other income | 708,047 | 627,612 | 1,730,119 | 1,212,622 | ||||||||||||
Net Operating Income | 7,131,312 | 14,504,379 | 27,353,439 | 38,649,779 | ||||||||||||
Average daily production | ||||||||||||||||
Crude oil (bbl/d) | 1,986 | 2,170 | 2,046 | 1,644 | ||||||||||||
NGLs (boe/d) | 432 | 240 | 391 | 163 | ||||||||||||
Natural gas (mcf/d) | 8,647 | 6,535 | 7,961 | 4,206 | ||||||||||||
Total (boe/d) | 3,858 | 3,500 | 3,764 | 2,507 | ||||||||||||
Operating Netback per boe | ||||||||||||||||
Oil and Natural Gas Sales | 62.38 | 82.47 | 62.30 | 92.60 | ||||||||||||
Royalties | (8.26 | ) | (13.37 | ) | (11.18 | ) | (14.88 | ) | ||||||||
Operating Expenses | (37.60 | ) | (30.83 | ) | (31.72 | ) | (25.64 | ) | ||||||||
Operating Netbacks ($/boe) | 16.52 | 38.27 | 19.40 | 52.08 | ||||||||||||
Operating Netbacks, after hedging ($/boe) | 18.09 | 43.10 | 24.94 | 54.69 | ||||||||||||
Operating Income Profit Margin | 26.5 | % | 46.4 | % | 31.1 | % | 56.2 | % | ||||||||
Operating Income Profit Margin, after hedging | 29.0 | % | 52.3 | % | 40.0 | % | 59.1 | % | ||||||||
Share information | ||||||||||||||||
Common shares outstanding, end of period | 215,393,217 | 201,247,706 | 215,393,217 | 201,247,706 | ||||||||||||
Weighted average basic shares outstanding | 215,249,087 | 199,711,392 | 213,861,560 | 164,762,938 | ||||||||||||
Weighted average diluted shares outstanding | 215,249,087 | 222,398,843 | 213,861,560 | 170,622,352 | ||||||||||||
Q3 2023 FINANCIAL SUMMARY
In Q3 2023, the Company realized average daily production volume of 3,858 boepd (63% Liquids), resulting in crude and natural gas sales of $22.1 million oil and natural gas sales and realized hedge gain of $0.5 million. This generated a net operating income of $7.1 million, after royalties, operating expenses, and processing and other income.
Capital expenditures in the quarter totaled $8.5 million, $4.0 million less than forecasted. The Company's active drilling program in Southeast Saskatchewan contributed $7.5 million to the total, with the remainder being allocated primarily to abandonment/reclamation work and land purchases. The Company expects an increase in Q4 2023 capital expenditures and maintains its 2023 capital target of ~$30 million.
Operating costs, which include expenses incurred to operate wells, gather, treat, and transport production volumes, as well as costs to perform well and facility repairs and maintenance, were higher compared to previous periods. The Company proactively chose to perform seven facility turnarounds that were overdue on the recent acquisitions. Annual costs incurred in Q3 2023 such as property taxes, government fees and levies and increased water and emulsion trucking costs during evaluation stages of new wells also contributed to the increased operating expenses of the quarter. The Company expects operating costs to normalize back to previous levels in Q4 2023 and through 2024.
NET DEBT
Net Debt as at September 30, 2023, and December 31, 2022, as outlined below:
| September 30, 2023 | December 31, 2022 | |||||||
Cash and cash equivalents | - | 5,258,881 | ||||||
Accounts receivable | 12,614,460 | 10,862,673 | ||||||
Prepaids and deposits | 609,242 | 1,144,672 | ||||||
Risk management contracts | (1,704,538 | ) | 4,418,471 | |||||
Accounts payable | (12,981,473 | ) | (13,678,677 | ) | ||||
Adjusted working capital (2) | (1,462,309 | ) | 8,006,020 | |||||
Credit Facility (8.2%) (1) | 13,113,586 | - | ||||||
Lease obligations (1) | 438,252 | - | ||||||
Senior Loan Facility (15%) (1) | - | 43,347,566 | ||||||
Less: adjusted working capital (2) | 1,462,309 | (8,006,020 | ) | |||||
Net debt | 15,014,147 | 35,341,546 | ||||||
- Represents undiscounted face value of debt balances and lease obligations outstanding as of each respective date presented.
- Calculation of adjusted working capital excludes current portion of debt as presented on the statement of financial position. The mark-to-market fair value of the current portion of risk management contracts is included within adjusted working capital.
ROK uses "Net Debt" as a measure of the Company's financial position and liquidity, however it is not intended to be viewed as an alternative to other measures calculated in accordance with IFRS.
Complete reports and statements are available on SEDAR+ at www.sedarplus.ca and on the Company website www.rokresources.ca.
LITHIUM UPDATE
The Company, as a twenty-five (25%) percent shareholder and manager of operations of Hub City Lithium Corp., remains on track for the release of the Preliminary Economic Assessment in Q4 2023.
About ROK
ROK is primarily engaged in exploring for petroleum and natural gas development activities in Alberta and Saskatchewan. It has offices located in both Regina, Saskatchewan, Canada and Calgary, Alberta, Canada. ROK's common shares are traded on the TSX Venture Exchange under the trading symbol "ROK".
For further information, please contact:
Cameron Taylor, Chairman and Chief Executive Officer
Bryden Wright, President and Chief Operating Officer
Jared Lukomski, Senior Vice President, Land & Business Development
Lynn Chapman, Chief Financial Officer
Phone: (306) 522-0011
Email: investor@rokresources.ca
Website: www.rokresources.ca
Non-IFRS Measures
The non-IFRS measures referred to above do not have any standardized meaning prescribed by International Financial Reporting Standards ("IFRS") and, therefore, may not be comparable to similar measures used by other companies. Management uses this non-IFRS measurement to provide its shareholders and investors with a measurement of the Company's financial performance and are not intended to represent operating profits nor should they be viewed as an alternative to cash provided by operating activities, net income or other measures of financial performance calculated in accordance with IFRS. The reader is cautioned that these amounts may not be directly comparable to measures for other companies where similar terminology is used. "Operating Income" is calculated by deducting royalties and operating expense from total sales revenue. Total sales revenue is comprised of oil and gas sales. The Company refers to Operating Income expressed per unit of production as an "Operating Netback". "Operating Income Profit Margin" is calculated by the Company as Operating Income as a percentage of oil and natural gas sales. "Funds from Operations" is calculated by adding other income and realized gains/losses on commodity contracts ("hedging") to Operating Income. "Net Debt" includes all indebtedness of the Company, such as the Term Loan, Credit Facility, and Senior Loan Facility (as defined within the Company's interim condensed financial statements for the nine months ended September 30, 2023), net of Adjusted Working Capital. "Adjusted Working Capital" is calculated as current assets less current liabilities, excluding current portion of debt as presented on the Company's statement of financial position within the Company's interim condensed financial statements for the nine months ended September 30, 2023.
"Funds Flow" includes all cash for (used in) operating activities and is calculated before the change in non-cash working capital. "Funds flow", "funds flow basic ($/share)" and "funds flow diluted ($/share)" are capital management measures and are key measures of operating performance as they demonstrate the Company's ability to generate the cash necessary to repay debt and fund capital investments. Management believes that by excluding the temporary impact of changes in non-cash operating working capital, funds flow, funds flow basic ($/share) and funds flow diluted ($/share) provide useful measures of ROK's ability to generate cash that are not subject to short-term movements in non-cash operating working capital. Funds flow on a per share basis (basic and diluted) is calculated by dividing funds flow by the weighted average number of basic shares and weighted average number of diluted shares outstanding for the relevant period.
The following table reconciles cash flow from operating activities to funds flow:
| Q3 2023 | Q3 2022 | YTD 2023 | YTD 2022 | |||||||||||||
Cash provided by operating activities | 5,600,679 | 12,427,942 | 22,250,783 | 28,783,787 | ||||||||||||
Change in non-cash working capital | (297,499 | ) | 1,044,842 | </ | ||||||||||||